
Bitcoin Dips to $66K Close: Navigating Uncertainty in a Volatile Market
As Bitcoin wraps up another trading week on Friday, April 3, 2026, the cryptocurrency market finds itself at a crossroads. Closing at $66,895, the price reflects a modest decline amid broader market hesitations. This weekly close analysis delves into the price action, macroeconomic influences, ETF dynamics, technical indicators, and forward-looking predictions. With a 24-hour change of -1.75%, a 7-day drop of -2.81%, and a 30-day slip of -2.01%, Bitcoin's performance suggests a consolidation phase rather than a decisive trend. The market capitalization stands at $1,338.64 billion, supported by a 24-hour trading volume of $47.21 billion, while the blockchain has reached block height 943,436. These metrics paint a picture of resilience tempered by caution, setting the stage for potential weekend volatility.
Price Action Analysis
The week's closing price of $66,895 marks a subtle yet telling retreat from recent highs, underscoring Bitcoin's struggle to maintain momentum above the $67,000 threshold. This level has acted as a psychological barrier, with intraday highs teasing $68,000 earlier in the week before sellers stepped in. The 24-hour decline of -1.75% aligns with broader crypto market sentiment, where altcoins like Ethereum and Solana also posted losses, amplifying Bitcoin's dominance at around 55%.
📊 Chart Analysis
Daily & Weekly Charts
| Daily Chart | Weekly Chart |
|---|---|
 |
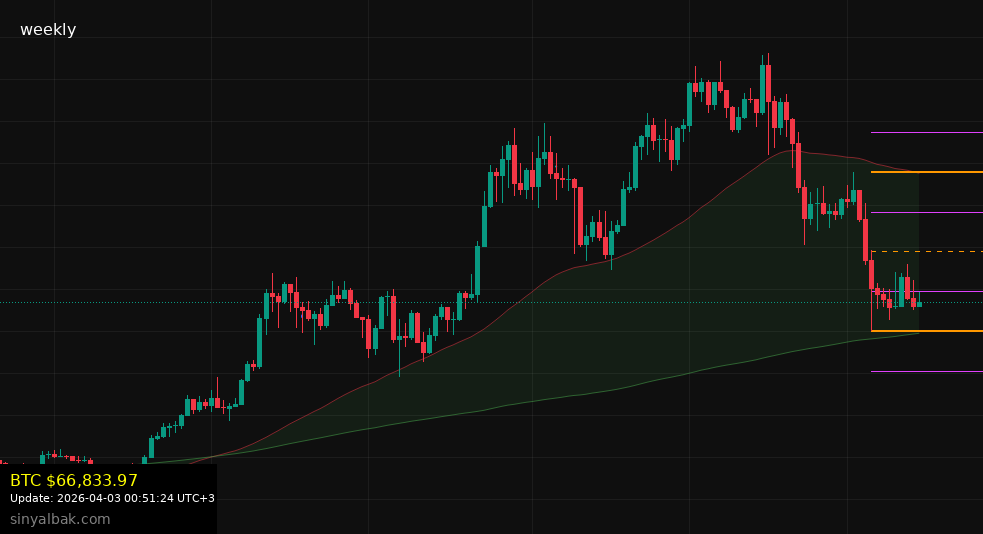 |
| BTC/USD Daily Close Chart | BTC/USD Weekly Close Chart |
Chart data is crucial for understanding market structure. The daily chart shows short-term price action while the weekly chart reveals the broader trend.
Weekly Performance Breakdown
- Intraday Movements: Bitcoin opened the week at approximately $68,500, buoyed by early optimism from institutional buying. Mid-week, it dipped to $65,200 during a flash sell-off triggered by profit-taking, before recovering modestly to the close.
- Volume Insights: The 24-hour volume of $47.21 billion indicates sustained interest but lacks the explosive spikes seen in bull runs. This moderated activity suggests traders are positioning cautiously, possibly awaiting clearer signals from global events.
- Comparative Changes:
Period Change Implications 24h -1.75% Short-term bearish pressure, but not panic-selling levels. 7d -2.81% Weekly consolidation, hinting at fatigue after prior gains. 30d -2.01% Monthly stability, with Bitcoin hovering in a $65K-$70K range.
This price action implies a market in digestion mode, where the closing figure could influence weekend trading. If dip-buyers emerge, we might see a rebound; otherwise, further downside risks loom, potentially testing lower supports. Historically, such closes have preceded volatile weekends, especially with reduced liquidity in after-hours trading.
Market Sentiment Indicators
Traders are closely watching on-chain metrics for clues. The block height of 943,436 reflects a healthy network, with transaction fees remaining low, encouraging retail participation. However, the realized price for short-term holders sits around $62,000, meaning many recent buyers are underwater, which could exacerbate selling if sentiment sours. Fear & Greed Index readings hover in the "neutral" zone at 52, a step back from last week's greed-fueled highs. This balanced sentiment suggests the market is neither overly optimistic nor panicked, but the closing price's downward tilt could tip the scales toward caution.
In summary, this week's price action reveals a Bitcoin that's resilient yet vulnerable. The close below $67,000 signals potential consolidation, with implications for the weekend outlook leaning toward range-bound trading unless external catalysts intervene.
Macroeconomic Factors
Bitcoin's performance doesn't occur in a vacuum; it's deeply intertwined with global economic currents. As we head into the weekend of April 4-5, 2026, several macroeconomic factors are shaping the narrative, from monetary policy shifts to geopolitical tensions.
Interest Rates and Central Bank Policies
The Federal Reserve's recent stance on interest rates remains a pivotal influence. With inflation cooling to 2.1% annually—down from 2025's peaks—the Fed has signaled potential rate cuts in Q2 2026. This dovish pivot could bolster risk assets like Bitcoin, as lower rates typically encourage investment in high-yield alternatives. However, the closing price dip suggests markets are pricing in delays, with traders wary of hotter-than-expected jobs data due next week.
- Positive Angle: Anticipated cuts could drive liquidity into crypto, mirroring the 2024 bull run.
- Risk Factor: If the European Central Bank follows suit with aggressive easing, it might strengthen the dollar, pressuring Bitcoin's USD-denominated price.
Geopolitical and Regulatory Developments
Tensions in the Middle East and ongoing U.S.-China trade talks add layers of uncertainty. A recent escalation in energy prices—oil hitting $85 per barrel—has ripple effects, as higher costs could stoke inflation and delay rate cuts. On the regulatory front, the SEC's approval of additional crypto derivatives in March 2026 has been a boon, but pending legislation on stablecoins could introduce volatility.
- Energy Market Ties: Bitcoin mining's energy intensity makes it sensitive to oil fluctuations; sustained high prices might increase operational costs for miners, leading to sell-offs.
- Global Adoption Trends: Positive news from El Salvador's Bitcoin bond issuance, now yielding 8%, contrasts with crackdowns in parts of Asia, creating a mixed bag for investor confidence.
Broader Economic Indicators
Unemployment remains low at 3.8%, supporting consumer spending, but equity markets like the S&P 500 closed flat this week, mirroring Bitcoin's lethargy. Gold, often a Bitcoin competitor, surged to $2,500 per ounce, drawing safe-haven flows amid uncertainty. For the weekend, these factors suggest Bitcoin could face headwinds if stock futures weaken, but a surprise positive development—like a breakthrough in U.S. debt ceiling talks—might spark a rally.
Overall, macroeconomic factors point to a cautious outlook. The interplay of easing policies and external risks could either stabilize Bitcoin around current levels or push it lower, depending on weekend news flow.
ETF Flows
Bitcoin ETFs continue to be a barometer for institutional interest, with flows providing critical insights into market direction. This week's data shows a net inflow slowdown, aligning with the price dip and signaling tempered enthusiasm.
Recent Flow Trends
Spot Bitcoin ETFs, led by giants like BlackRock's iShares Bitcoin Trust (IBIT) and Fidelity's Wise Origin Bitcoin Fund (FBTC), recorded net inflows of approximately $1.2 billion over the past seven days—a respectable figure but down from February's $3 billion peaks. Outflows from Grayscale's Bitcoin Trust (GBTC) have stabilized at $200 million weekly, as fee reductions stem the bleed.
- Inflow Drivers: Institutional allocations from pension funds and hedge funds, seeking Bitcoin as an inflation hedge.
- Outflow Pressures: Retail investors rotating into altcoin ETFs amid Bitcoin's range-bound action.
Comparative ETF Data
| ETF Provider | Weekly Net Flow | AUM (Billions) | Implications |
|---|---|---|---|
| BlackRock | +$800M | $25.4 | Strong buy-in, supporting price floors. |
| Fidelity | +$500M | $18.7 | Consistent growth, indicating long-term bets. |
| Grayscale | -$200M | $28.1 | Lingering outflows, but slowing pace suggests stabilization. |
| Others | +$100M | $10.2 | Emerging players adding diversity to flows. |
These flows imply that while institutions are accumulating, the pace has cooled, contributing to the week's -2.81% decline. For the weekend, ETF trading volumes—often lighter—could amplify price swings if large redemptions occur. Positive flows have historically preceded breakouts, so monitoring Saturday's preliminary data will be key.
Institutional Sentiment
Whale activity, including moves by firms like MicroStrategy (now holding over 250,000 BTC), reinforces ETF trends. Their continued buying underscores confidence, but the closing price suggests not all inflows are translating to immediate upside. As we look ahead, ETF flows could dictate whether Bitcoin tests resistance or retreats, with implications for broader adoption.
Technical Outlook with Support/Resistance Levels
From a technical perspective, Bitcoin's chart reveals a consolidation pattern, with the weekly close at $66,895 forming a potential doji candle—indicating indecision. Moving averages provide a mixed signal: the 50-day SMA at $67,200 acts as immediate resistance, while the 200-day SMA at $58,000 offers long-term support.
Key Support and Resistance Levels
- Resistance:
- $68,000: Recent high; breaking this could target $70,000.
- $70,500: Fibonacci retracement level from the all-time high.
- $72,000: Psychological barrier, aligned with prior peaks.
- Support:
- $65,000: Strong floor, defended multiple times this month.
- $62,000: 100-day SMA; a break here risks deeper correction.
- $60,000: Major support zone, coinciding with miner capitulation levels.
Chart Patterns and Indicators
The Relative Strength Index (RSI) sits at 48 on the daily chart—neutral territory, avoiding overbought conditions. MACD shows a bearish crossover, hinting at short-term downside, but Bollinger Bands are contracting, suggesting an impending volatility spike.
- Bullish Scenario: A close above $67,500 on Saturday could invalidate the bearish MACD, targeting $70,000 by mid-next week.
- Bearish Scenario: Failure to hold $65,000 might lead to a retest of $62,000, especially with low weekend volume.
On-chain indicators like the Puell Multiple (at 1.2) indicate miners are profitable, reducing sell pressure. For the weekend, expect range trading between $65K and $68K unless a catalyst emerges.
Key Predictions
Looking ahead to the weekend and beyond, several predictions emerge based on the current close.
- Short-Term Weekend Outlook: Bitcoin is likely to trade sideways, with a 60% chance of closing above $66,500 by Sunday. Low volume could lead to whipsaws, but dip-buying at $65,000 support may prevent major drops.
- Mid-Term (Next 7-14 Days): If macroeconomic tailwinds strengthen—such as Fed rate cut confirmations—expect a push toward $70,000. Conversely, persistent outflows or geopolitical flares could drive prices to $62,000.
- Long-Term Bull Case: With halving effects from 2024 still unfolding and ETF maturation, Bitcoin could eye $80,000 by Q3 2026, assuming regulatory clarity.
- Risks to Monitor:
- Sudden ETF redemptions amplifying downside.
- Macro surprises, like unexpected inflation data.
- Technical breakdowns below key supports.
In essence, this weekly close positions Bitcoin for cautious optimism. Traders should watch for catalysts while managing risks, as the market's next move hinges on breaking free from current consolidation.
By Osman Aktaş
Senior Bitcoin Analyst at Sinyalbak
Follow on X: https://x.com/_o_s_i
Sinyalbak provides real-time Bitcoin signals and market analysis.