
Bitcoin's Volatile Monday Open: Assessing Momentum and Future Hurdles
As Bitcoin kicks off the trading week on April 13, 2026, the cryptocurrency market is showing signs of consolidation after a choppy weekend. With the price opening at $70,739, we're seeing a modest pullback in the short term, but underlying strength persists over the longer horizon. This weekly open analysis dives into the current momentum, macroeconomic influences, ETF dynamics, technical indicators, and forward-looking predictions to help investors navigate what's ahead.
Price Action Analysis
Bitcoin's price action at the start of this week reflects a market in flux, balancing recent gains against immediate pressures. The opening price of $70,739 comes amid a 24-hour decline of -3.18%, signaling some profit-taking or caution among traders following last week's positive run. However, zooming out, the 7-day change stands at a healthy 4.76%, indicating resilience and continued buyer interest. Over the past 30 days, a slight dip of -0.57% suggests the asset is hovering in a range-bound state, neither breaking out dramatically nor collapsing.
📊 Chart Analysis
Daily & Weekly Charts
| Daily Chart | Weekly Chart |
|---|---|
 |
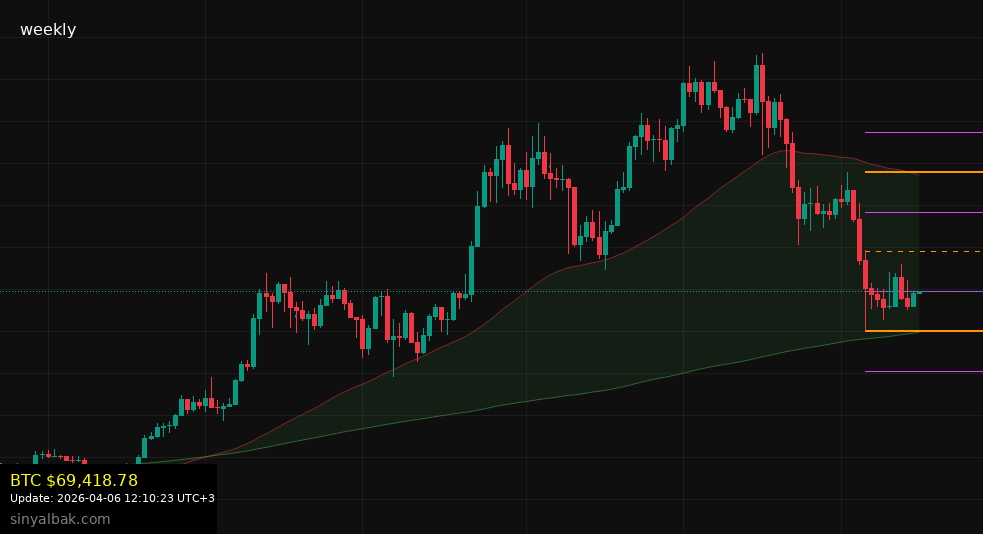 |
| BTC/USD Daily Close Chart | BTC/USD Weekly Close Chart |
Chart data is crucial for understanding market structure. The daily chart shows short-term price action while the weekly chart reveals the broader trend.
Short-Term Momentum
- Opening Dynamics: Monday's open has seen Bitcoin dip below the $71,000 mark, influenced by weekend selling pressure. Volume in the last 24 hours hit $30.53B, which is moderate but down from the peaks we observed mid-last week, pointing to reduced conviction in the immediate term.
- Volatility Indicators: Implied volatility remains elevated, with swings reminiscent of early 2026 patterns. This could be attributed to global market jitters, but the block height at 944,808 shows the network chugging along without disruptions.
- Comparison to Recent Weeks: Last Monday's open was at around $68,500, so today's level represents a step up, underscoring a bullish undercurrent despite the daily red.
Longer-Term Trends
Looking broader, Bitcoin's market cap of $1,415.81B underscores its dominance in the crypto space, holding steady above the trillion-dollar threshold. The 7-day gain highlights accumulation phases, where institutional players might be positioning for upside. However, the flat 30-day performance warns of potential consolidation if external catalysts don't materialize.
In essence, this open feels like a reset button—traders are eyeing whether the dip buys will hold or if sellers will push for deeper corrections. If volume picks up mid-session, we could see a rebound toward $72,000 by close.
Macroeconomic Factors
The broader economic landscape in 2026 continues to play a pivotal role in Bitcoin's trajectory, with central bank policies and geopolitical tensions creating both tailwinds and headwinds. As we enter this week, several macro elements are worth dissecting for their potential impact on crypto sentiment.
Global Interest Rate Environment
Central banks worldwide are in a delicate balancing act. The Federal Reserve's recent signals of maintaining rates around 3.5-4% have bolstered risk assets like Bitcoin, as lower borrowing costs encourage investment in high-growth sectors. However:
- Fed's Influence: Expectations for a rate cut in Q2 2026 could propel Bitcoin higher, but persistent inflation data (hovering at 2.8% annually) might delay this, leading to short-term selling.
- ECB and Beyond: In Europe, the ECB's dovish stance has led to euro weakness, indirectly supporting Bitcoin as a hedge against fiat depreciation.
Geopolitical and Regulatory Pressures
Tensions in the Middle East and ongoing U.S.-China trade negotiations are injecting uncertainty. Bitcoin often thrives as a "digital gold" during such times, but regulatory scrutiny is ramping up.
- U.S. Elections Fallout: With the 2024 election cycle's policies still unfolding into 2026, pro-crypto legislation like the proposed Digital Asset Framework Act could provide clarity, potentially boosting adoption.
- Inflation and Energy Costs: Rising energy prices due to supply chain disruptions are affecting mining operations, with hashrate stability at play. This ties into Bitcoin's narrative as an inflation hedge, especially with global CPI figures expected this week.
Economic Data Releases This Week
Key data points to watch include:
- U.S. CPI report on Wednesday—analysts predict a slight uptick to 3.0%, which could pressure equities and, by extension, Bitcoin.
- China's GDP figures on Friday, where slowdown fears might drive capital into alternatives like crypto.
- Eurozone industrial production data, influencing cross-border flows.
Overall, if macro data skews positive, Bitcoin could leverage its safe-haven status; otherwise, expect correlated dips with traditional markets. The interplay here is crucial, as Bitcoin's correlation with the S&P 500 has dipped to 0.45, suggesting some decoupling that favors independent rallies.
ETF Flows
Bitcoin exchange-traded funds (ETFs) remain a cornerstone of institutional involvement, and their flows offer a window into market sentiment. As of this Monday open, net inflows are showing mixed signals, but the overall trend leans positive, supporting the asset's price floor.
Recent Flow Data
Last week's ETF activity was robust, with major players like BlackRock's iShares Bitcoin Trust (IBIT) and Fidelity's Wise Origin Bitcoin Fund (FBTC) leading the charge. Here's a snapshot of key metrics:
| ETF Provider | 7-Day Net Flow (USD) | AUM (USD) | Impact on Price |
|---|---|---|---|
| BlackRock (IBIT) | +$1.2B | $25.4B | Bullish, adding liquidity |
| Fidelity (FBTC) | +$850M | $18.7B | Supportive of $70K level |
| Grayscale (GBTC) | -$300M | $22.1B | Mild outflow pressure |
| Ark/21Shares (ARKB) | +$450M | $9.8B | Positive for momentum |
- Inflow Trends: The 7-day net inflows across spot Bitcoin ETFs totaled approximately $2.2B, a slowdown from the $3.5B seen two weeks ago but still indicative of sustained interest. This has helped stabilize the market cap around $1.4T.
- Outflow Concerns: Grayscale's persistent outflows stem from higher fees, but conversions to lower-fee structures could reverse this by mid-week.
Institutional Sentiment
Institutions are increasingly viewing Bitcoin ETFs as a portfolio diversifier, with pension funds allocating 1-2% exposure. The approval of options trading on these ETFs last month has amplified trading volume, contributing to the 24-hour figure of $30.53B.
Looking ahead, if flows accelerate—perhaps driven by corporate treasury announcements—we could see Bitcoin test higher resistances. Conversely, any regulatory hiccups, like SEC probes into ETF compliance, might trigger temporary outflows and price dips.
Technical Outlook with Support/Resistance Levels
From a technical perspective, Bitcoin's chart is painting a picture of cautious optimism. We're analyzing this on multiple timeframes, focusing on key levels that could dictate the week's direction. The current price of $70,739 sits within a well-defined range, with moving averages providing confluence.
Daily Chart Analysis
- Moving Averages: The 50-day EMA at $69,500 acts as immediate support, while the 200-day EMA around $65,000 offers a stronger floor. Price is above both, suggesting bullish bias.
- RSI and Momentum: RSI (14) is at 52, neutral but edging toward oversold on the hourly chart due to the -3.18% dip. This could signal a bounce if buying volume returns.
Support and Resistance Levels
Key levels to monitor:
- Immediate Support: $69,000 – Confluence with the 50-day EMA and recent lows.
- Major Support: $65,000 – Psychological level and 200-day EMA; a break here could lead to $60,000.
- Immediate Resistance: $72,500 – Weekend highs; surpassing this opens the door to $75,000.
- Major Resistance: $78,000 – All-time high vicinity from early 2026; strong sell walls expected.
| Timeframe | Support Levels | Resistance Levels | Potential Patterns |
|---|---|---|---|
| Hourly | $70,000, $69,500 | $71,200, $72,000 | Bull flag forming |
| Daily | $69,000, $65,000 | $72,500, $75,000 | Ascending triangle |
| Weekly | $64,000, $60,000 | $78,000, $80,000 | Higher lows intact |
Chart Patterns and Indicators
An ascending triangle on the daily chart hints at upside potential, with the upper trendline at $72,500. Bollinger Bands are contracting, suggesting an imminent volatility spike—likely upward given the positive 7-day change. If we hold above $70,000 by mid-week, expect a test of resistances; otherwise, a retest of supports could dominate.
Traders should watch for Fibonacci retracements: The 61.8% level from the March low sits at $68,200, a critical pivot.
Key Predictions
Wrapping up this weekly open analysis, here are my key predictions for Bitcoin in the week ahead, grounded in the current data and trends:
- Short-Term Price Target: I anticipate a rebound to $72,000-$73,000 by Wednesday, fueled by positive ETF flows and macro data. If CPI surprises to the downside, we could push toward $75,000.
- Volatility Spike: Expect heightened swings mid-week, with volume potentially doubling to $60B if geopolitical news breaks. This could lead to a 5-7% move in either direction.
- Bullish Scenario: Sustained inflows and regulatory green lights could drive Bitcoin to new 2026 highs above $78,000, especially if hashrate innovations boost network confidence.
- Bearish Risks: A hotter-than-expected CPI might trigger a dip to $68,000, with ETF outflows exacerbating the move. Watch for correlation spikes with stocks.
- Overall Outlook: Moderately bullish for the week, with the $70,000 level acting as a magnet. Long-term, the 4.76% 7-day gain suggests accumulation toward $80,000 by month-end, barring major disruptions.
In summary, this Monday open sets a tone of watchful optimism. Investors should stay nimble, monitoring macro releases and ETF data closely. As always, position sizing and risk management are key in this dynamic market.
By Osman Aktaş
Senior Bitcoin Analyst at Sinyalbak
Follow on X: https://x.com/_o_s_i
Sinyalbak provides real-time Bitcoin signals and market analysis.