SinyalBak analyzes consolidation zones in stocks, commodities, and cryptocurrencies. When support or resistance channel breakouts are confirmed, you receive instant notifications!

Professionel trading indicator that accurately detects price breakouts from support and resistance zones, enhanced with trend filters.

Automatically detects and visualizes major, middle, and intermediate support-resistance levels using six different lines based on pivot points. Breakouts at major support-resistance levels provide critical signals for trend continuation or reversal.
Uses an ATR (Average True Range) based dynamic filter system to distinguish real breakouts from false moves.
Determines the trend direction with 50 and 200 period moving averages, visualizes the trend zone, and only shows signals in the trend direction.
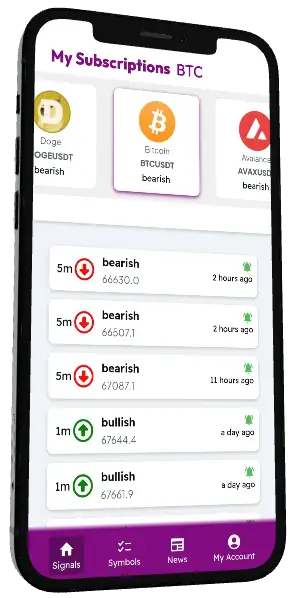
Receive automatic alerts at critical support and resistance breakouts, ensuring you never miss an opportunity.
All parameters (pivot points, breakout thresholds, MA settings) can be customized to your own strategy.
Clear visual labels and color coding that allow you to instantly notice breakout signals.
The indicator automatically detects significant support and resistance levels on the chart using pivot points and marks them with horizontal lines.
The general trend direction of the market is determined using 50 and 200 period moving averages. Uptrend is shown in green, downtrend in red.
When the price crosses significant support or resistance levels with a minimum threshold value calculated by ATR, the indicator generates breakout signals suitable for the trend direction.
The indicator only shows breakouts that are consistent with the direction of the trend; resistance breakout in an uptrend, support breakout in a downtrend. This produces a more reliable signal.
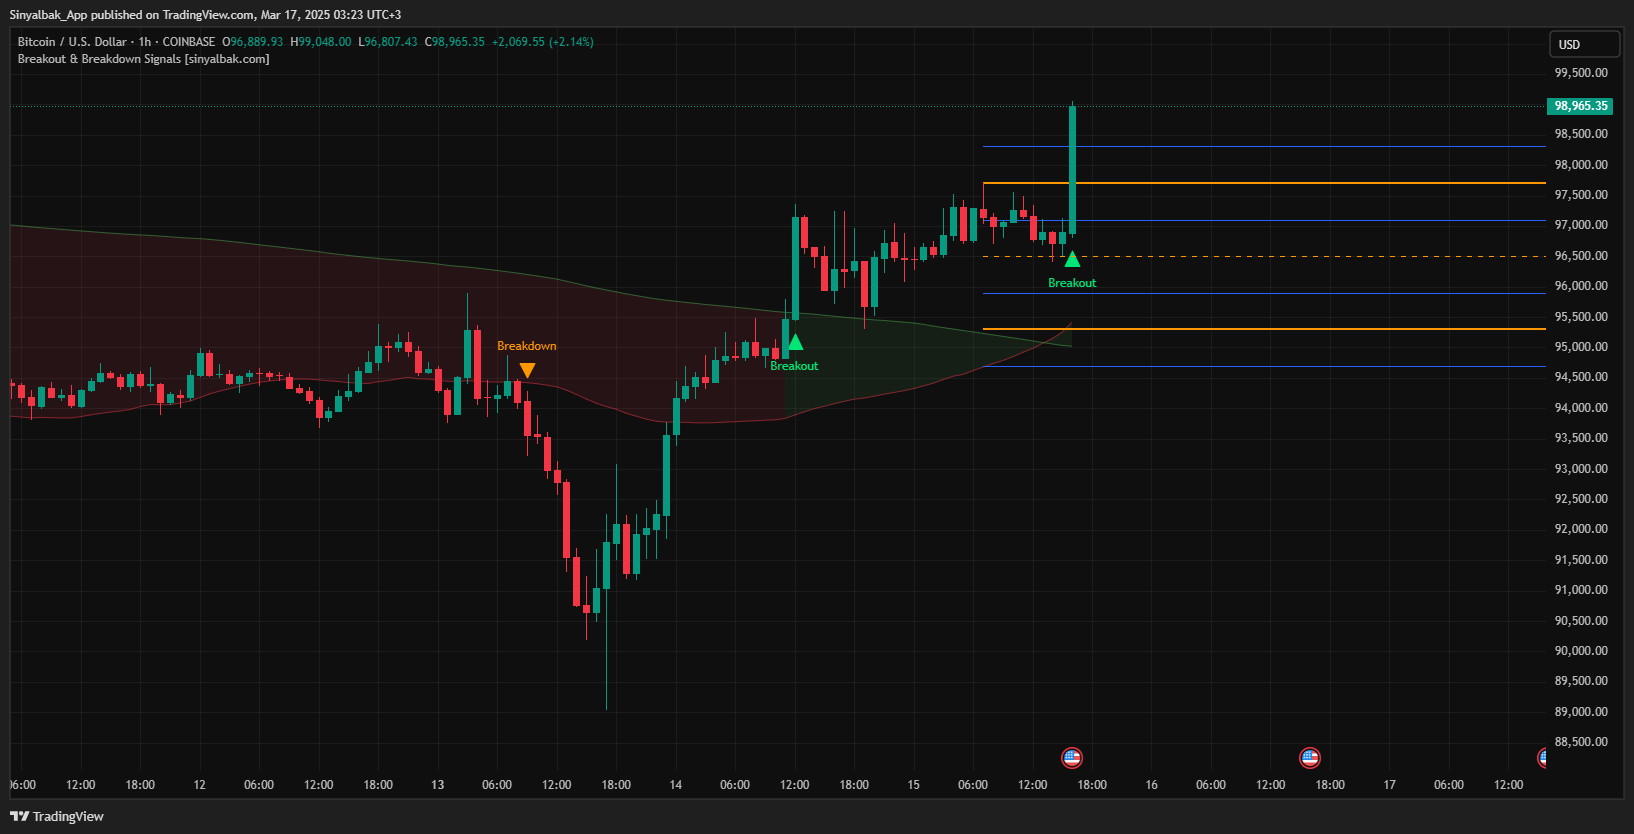
In this example, Bitcoin broke an important resistance level upwards while in an uptrend. The indicator detected this breakout and generated a "Breakout" signal. The price rose by 14% after the signal.
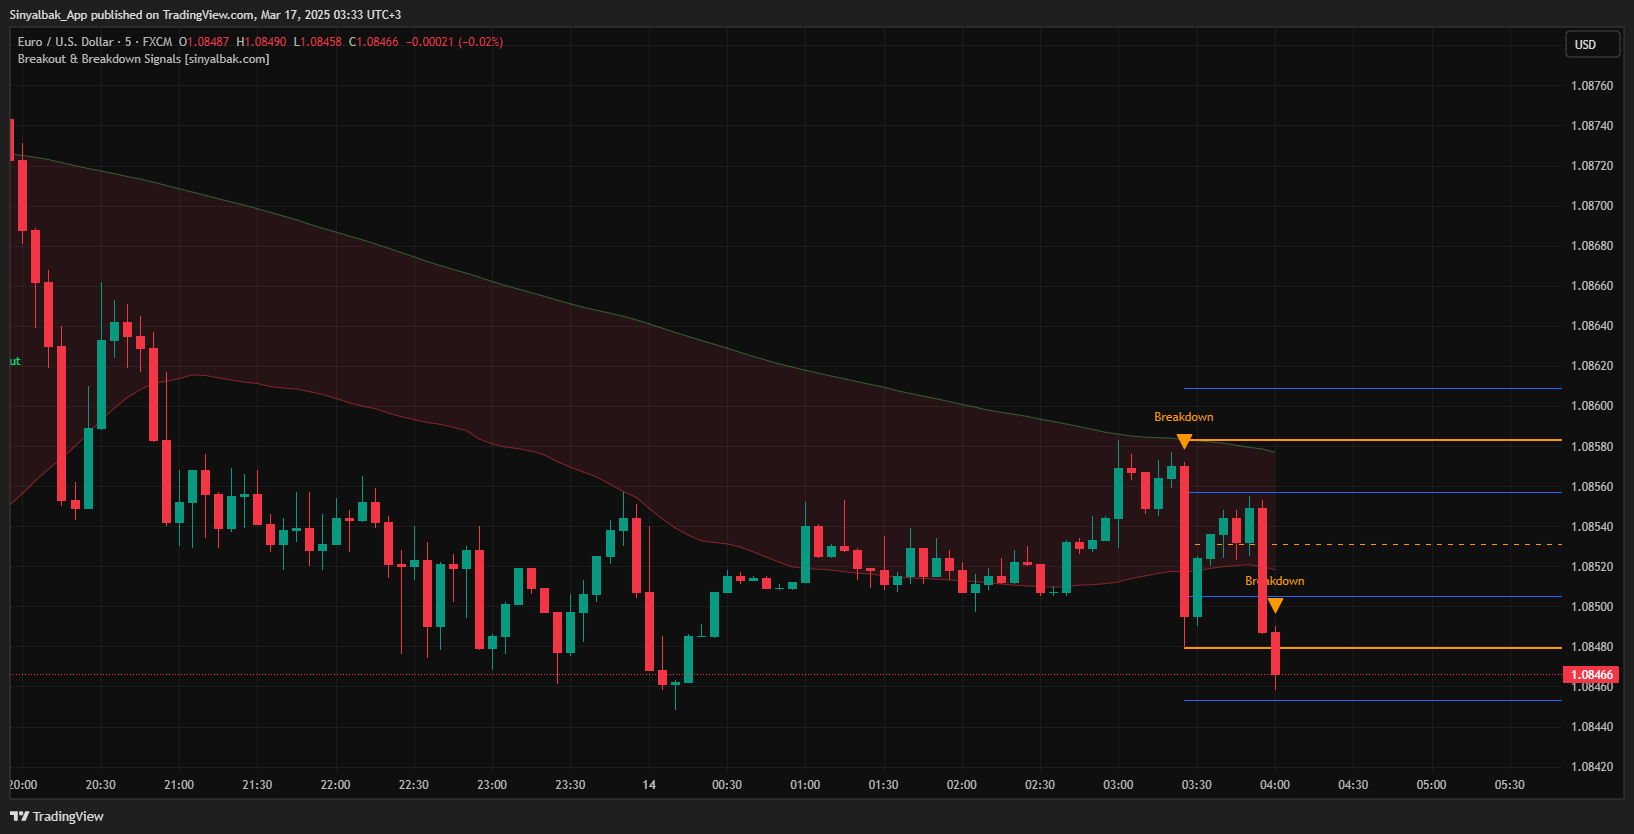
An important support level was broken in a downtrend in the EUR/USD pair. The indicator generated a "Breakdown" signal and the price fell 150 pips in the next 3 days.
"This indicator completely changed my trading system. I used to draw support and resistance manually and missed most breakouts. Now the indicator automatically detects and only shows signals in the direction of the trend. My profitability has increased by 65% in the last 3 months."

"The MA Trend Zone feature is amazing. I can now clearly see the direction of the trend and only focus on signals in the direction of the trend. The ATR filtering system is also very successful in eliminating fake breakouts. Definitely an indicator worth every penny."

"As a professional trader, I have tried many indicators, but I have rarely seen one that works so clearly and simply. Especially the alert system is very useful to me, I no longer have to constantly look at the charts. When the alert comes, I look and I usually catch good opportunities."

The indicator has been developed for the TradingView platform and can be used in all markets such as forex, cryptocurrency, stocks, and commodities.
The indicator can be used in all timeframes, but it produces more reliable signals in timeframes of 15 minutes and above. It gives the strongest signals on daily charts.
After the purchase is complete, you will be sent a special link and detailed installation instructions explaining how to install it on TradingView. The installation is very simple and only takes a few minutes.
No, with a one-time payment, you get lifetime free access to all future updates of the indicator.
Yes, we offer priority email support to all our customers. You can get a response within 24 hours at the latest if you have any questions or problems.
Catch critical price movements with the Support & Resistance Breakout Signals indicator, trade in line with the trend and increase your profitability.
Buy Now - $300