Notifications in Your Pocket
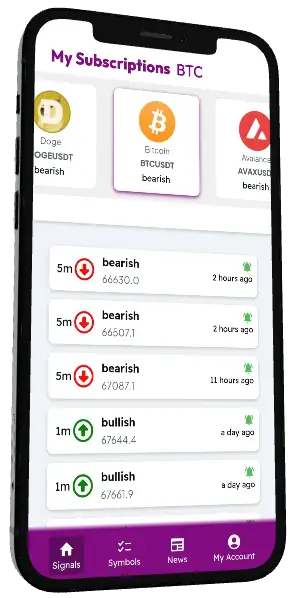
SinyalBak analyzes price reaction movements (Pullback) in stocks, commodities, and cryptocurrencies, sending notifications to your phone at the most accurate moment. You'll also receive the latest news updates.
Helps you open positions from the right zones, save time, and trade with less stress.

After Receiving a Pullback Trade Signal from SinyalBak
When evaluating Pullback signals from SinyalBak, follow these steps:
- First, check the 200-day moving average (200MA) trend. All signals are filtered according to this trend.
- Open long positions when buying signals occur in an uptrend, and short positions when selling signals occur in a downtrend.
- Place your stop-loss level below/above the pre-pullback swing point.
- Set your risk:reward ratio to a minimum of 1:2 for profit targets.
Important Warnings:
- Misleading signals called "fake-outs" may occur near the end of trends.
- Always follow risk management rules and don't risk more than 1-2% of your capital per trade.
- Be more cautious with signals that occur near the 200MA trend line.

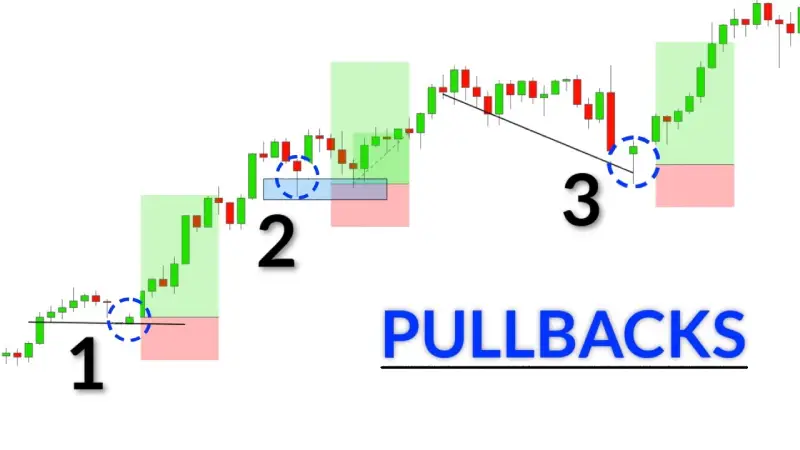
What is Pullback?
Pullback is a temporary retracement of price after a strong movement in the main trend direction. This movement creates ideal entry points for new positions. It can be thought of as a price 'rest' before the trend continues.

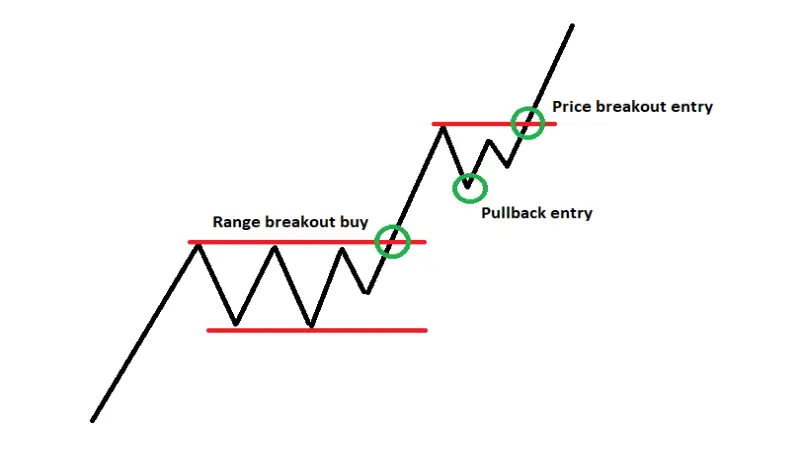
Uptrend Pullback Opportunities
In an uptrend, pullback is when price retraces to the previous resistance point (now support). These levels often coincide with Fibonacci retracement levels and offer strong buying opportunities.

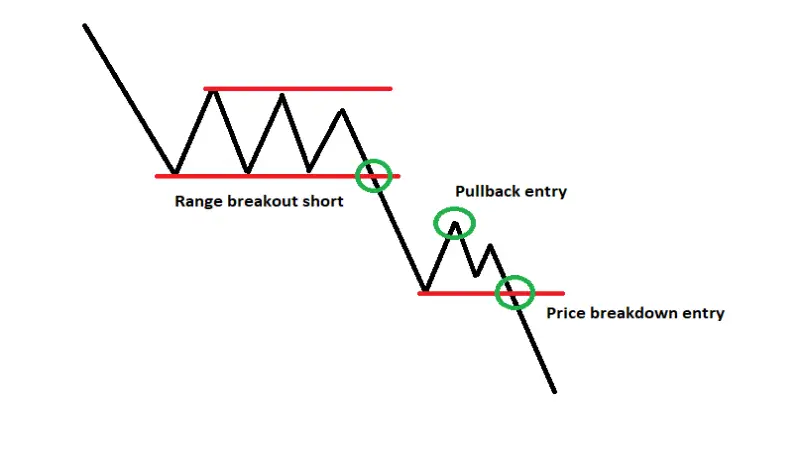
Downtrend Pullback Strategy
In a downtrend, pullback is a temporary rise towards the previous support level (now resistance). These points create ideal entry points for short positions in the trend direction.

Track with TradingView Indicator!
📱 Watch Mobile App Signals on Chart
You can track the signals generated by the Sinyalbak app live on the TradingView platform. By adding our indicator to your charts, you can analyze price reaction movements (Pullback) more effectively.
